Effects of antenna, packet size and signal quality on the power consumption of nb-iot modem Quectel BC95-G
technical
nb-iot
Date: 2020-06-27, Author: Lorenz Gruber
Outline:
- Motivation
- Hardware setup
- Software setup
- Tests
- Results and discussion
- Improvements
- Further testing
Motivation
The aim of nb-flow is to offer a variety of IoT sensor applications. When choosing a battery powered option, the battery should last at least one year. To be able to predict the battery life, one has to understand the power consumption of the nb-iot modem with all the variables that can change.
Those variables can be:
- signal quality (in a basement vs in the open field, close to cell tower vs far away)
- antenna (internal vs external antenna, size of antenna, quality )
- packet size (1 byte vs 1 kilo byte)
- protocol used to transmit (IP vs non IP data, upd vs tcp, e.g. mqtt vs coap, dtls or tls vs no encryption)
- PSM - power saving mode (on vs off and which TAU / active timer values are used)
- eDRX - extended discontinuous reception (on vs off and which cycle length values are used)
Another factor that affects the power consumption is which modem is used in the first place. In this blog post, a Quectel BC95-G modem is used.
This blog post will focus on signal quality, antenna and packet size.
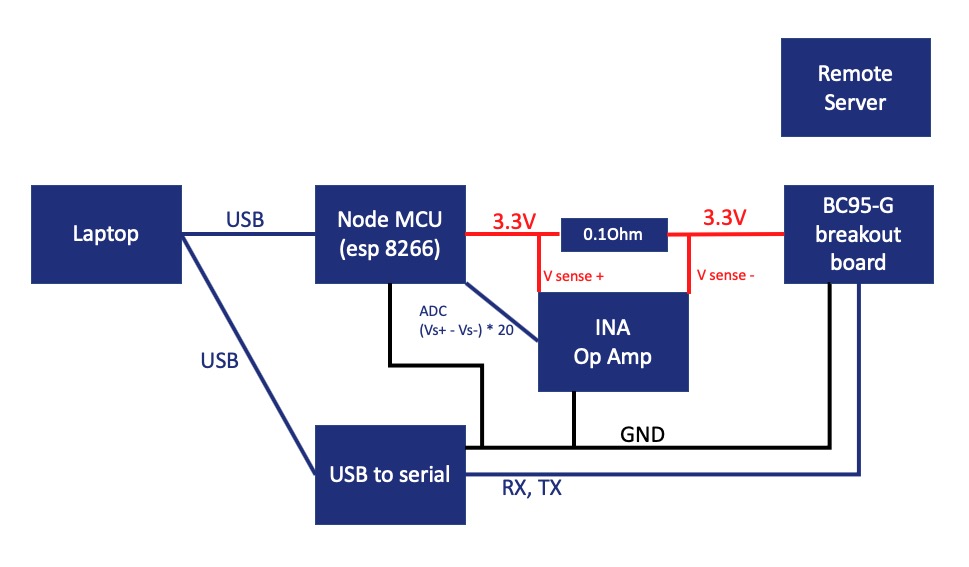
Hardware setup
The following components were used:
- Quectel BC95-G with custom breakout board
- UFL nb-iot antenna
- 1NCE Sim Card (uses band 8 and Deutsche Telekom network)
- 0.1 Ohm (1% accuracy) current sensing resistor
- TI INA chip that serves as an operational amplifier with a gain of 20 for the voltage across the current sensing resistor
- NodeMCU v3 board ESP8266 to measure the output of the INA chip via an ADC and write values to the serial port
- 3.3V regulator on the board is used to power the modem.
- laptop to record power consumption values and control to modem via AT commands
- usb to serial dongle
- small server on Hetzner cloud (to log incoming packets sent by the modem)
Below is a diagram showing the setup:
And this is a picture of the setup:
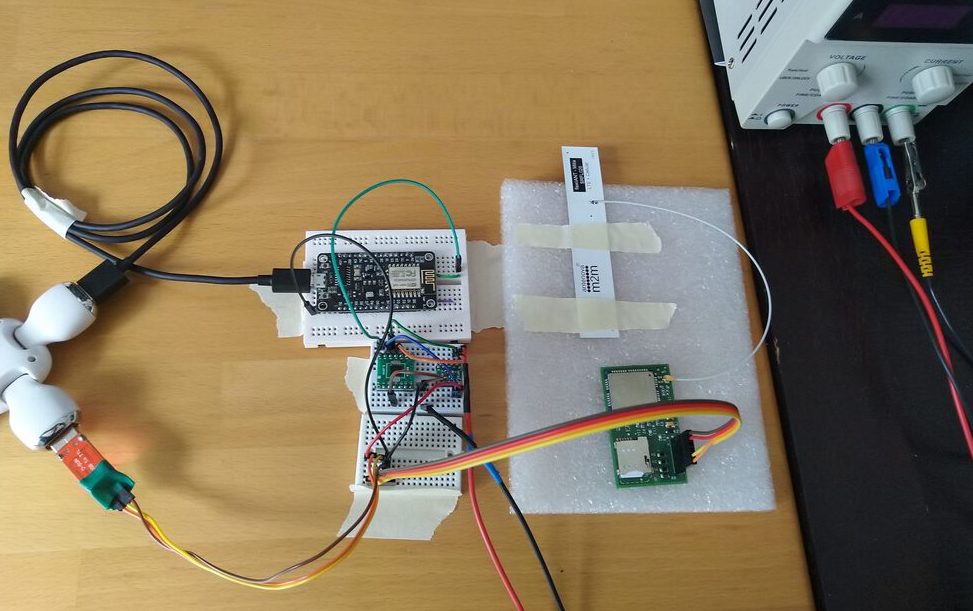
(please note that the pictures does not fully correspond to the diagram as a lab bench power supply was used to power the modem. But as the setup had to be portable it was then switched to the 3.3V regulator on the NodeMCU board)
This is a low cost setup which does a good job at comparing test results. The improvements section lists the drawbacks of this setup.
Software setup
- Quectel BC95-G
- Firmware
BC95GJBR01A04 - PSM setting: default, PSM on with 10 hour TAU timer and 10 second active timer
AT+CPSMS? +CPSMS:1,,,01000001,00000101 - eDRX setting: not supported by network
AT+CEDRXRDP +CEDRXRDP:0 - a list of all the settings used can be found here
- Firmware
- Laptop:
- script to control the modem
packet-sending.py- reboots the modem, waits 30 seconds to allow the modem to attach to the network and then sends a UDP packet every 60 seconds for 10 minutes.
- script to log the power consumption
log_consumption.py- the consumption is logged at 10 Hz and written to a csv
- script to plot the results
create_charts.py- takes all the csv files as inputs and creates graphs and result json object.
- script to control the modem
- Server
- script to log incoming udp requests
upd-echo.py - the packet that arrives has a parameter if the server should echo and if yes after which time.
- but the echo is not used for the tests in this article.
- script to log incoming udp requests
Tests
The following 4 parameters are outputs and can be used to "evaluate" the test results:
- average package latency
- average power consumption of the modem
- maximum power consumption of the modem
- percentage of packets arrived on the server
Scenario 1: Test different signal strengths
- city, indoors above ground (cell tower less than 500m away)
- city, basement (cell tower less than 500m away)
- countryside, indoors above ground (cell tower ca 2km away)
- countryside, basement (cell tower ca 2km away)
Scenario 2: Test different packet sizes
- payload of 16 bytes
- payload of 128 bytes
- payload of 1349 bytes (the AT command manual 1.4 from quectel says the maximum is 1358, however this did not work for us and the maximum was 1349)
Both scenarios were tested with two different antennas:
- Brand (referred to as
mitisfrom here on):- Antenova Mitis SRFL026
- 110mm long, 20mm wide
- purchased at tekmodul.de for 3.5€ for a single antenna
- No Name (referred to as
alifrom here on):- AliExpress
- 80mm long, 20mm wide
- purchased from AliExress for ca 0.5€ for a single antenna incl. shipping
Both of the antennas are flexible antennas that can be mounted inside a housing.
Results and discussion
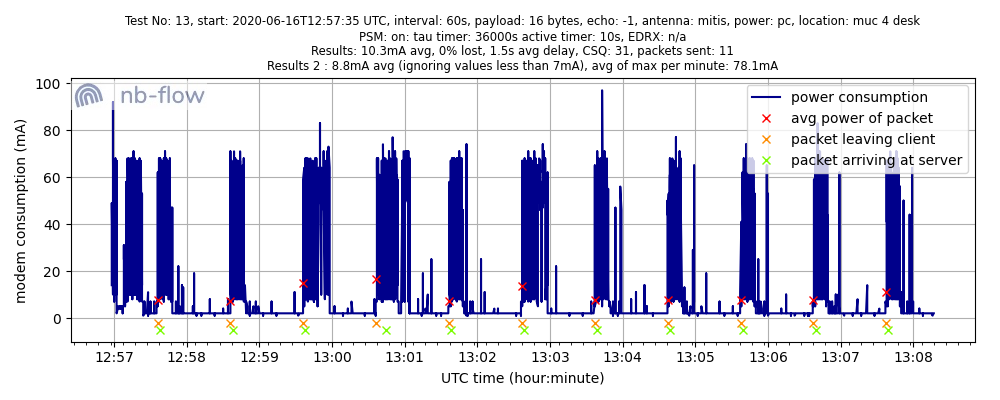
The tests are automated and create a png image as an output that is plotted with matplotlib. The following picture
shows the result of test number 8 (the row below with 08.png)
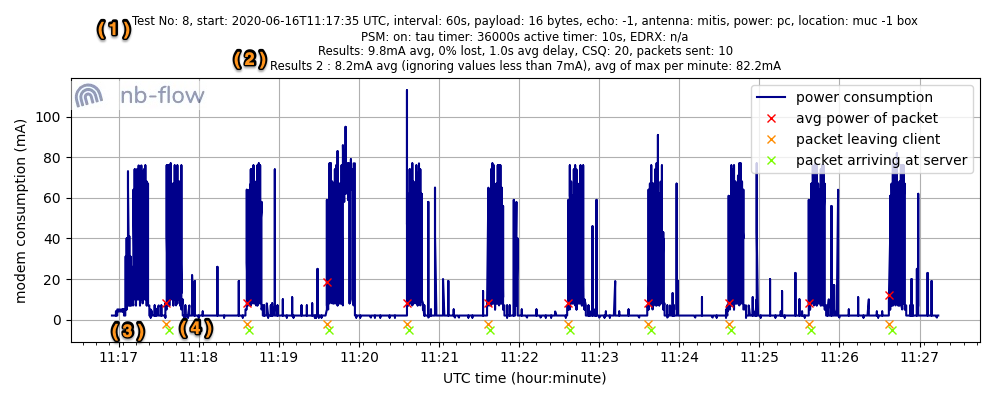
Explanations for the orange labels above:
- (1) input parameters for the test
- (2) output parameters for the test
- (3) startup procedure in which modem attaches to the network.
- (4) the orange and green
xshow the times when the udp packet leave the client and when it packet arrives on the server. The y value can be ignored. The redxshow the average power consumption.
One can observe, that the modem consumes most power after the packet arrived on the server. This comes unexpected, but we will dig deeper into this behaviour and report the findings in future blog posts. For now, the explanation is that the modem stays awake after the packet has been sent to listen to incoming packets.
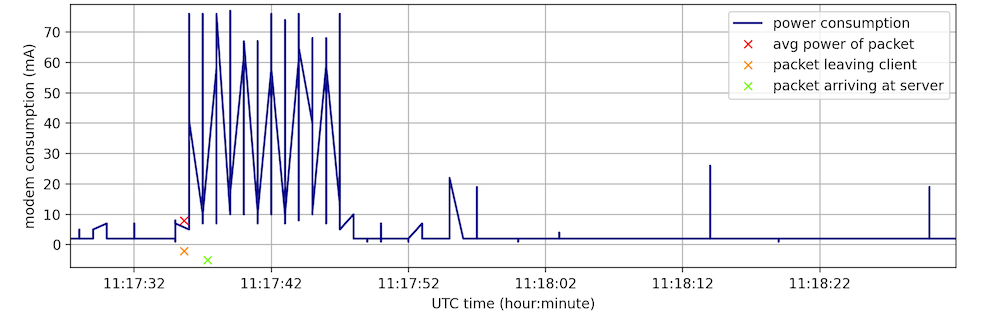
The picture below shows a zoom of the first packet of the chart above. You can see that though the packet arrives
after ca 2 seconds (orange and green x), the modem consumes power for ca 15 seconds.
There is a youtube video from Quectel that analyses the BC68 (which is the same as the BC95-G, just a smaller form factor). Unfortunately the image quality is not so good to be able to read the exact power consumption, but the graphs look similar.
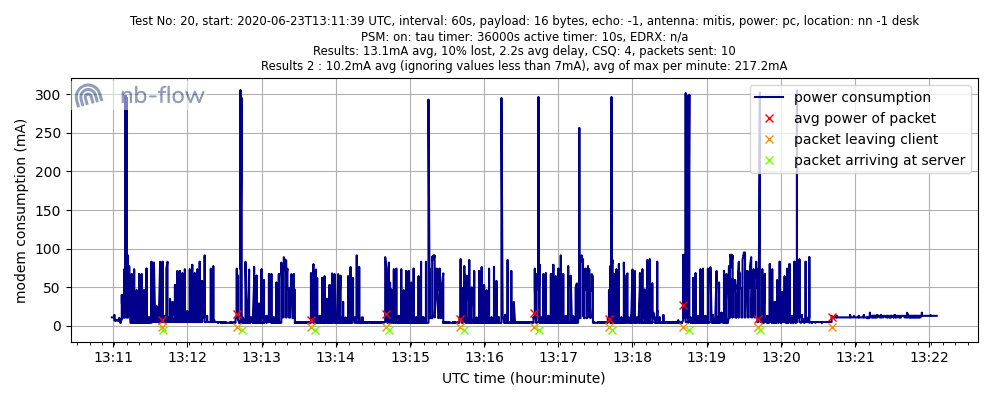
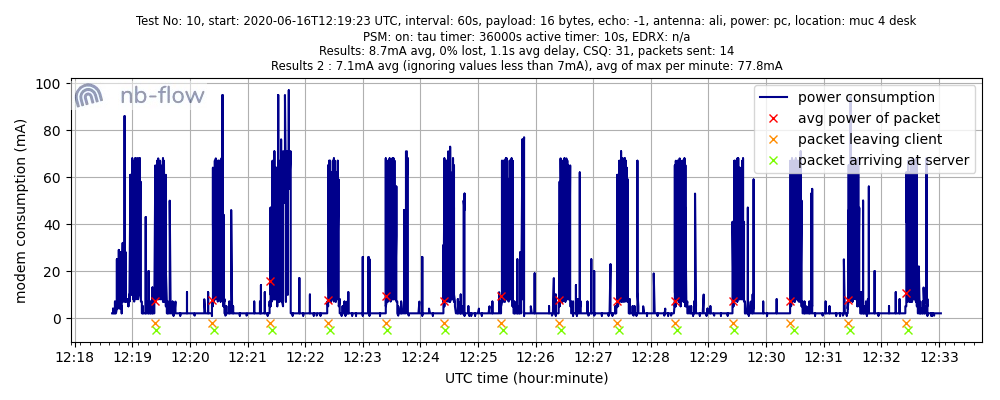
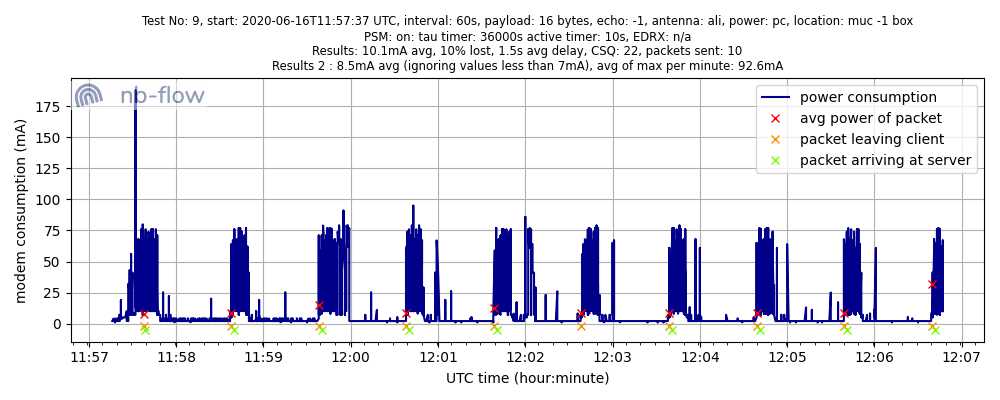
Scenario 1
- packets sent: 10
- packet size: 16 bytes payload
- interval: 60 seconds
Results:
| scenario | antenna | dbm | quality | avg p(ma) | dia | lat(s) | avg max p(mA) | diagram |
|---|---|---|---|---|---|---|---|---|
| city, indoors | mitis | -51 | excellent | 10.3 | 8.8 | 1.5 | 78.1 | 13.png |
| city basement | mitis | -73 | excellent | 9.8 | 8.2 | 1 | 82.2 | 08.png |
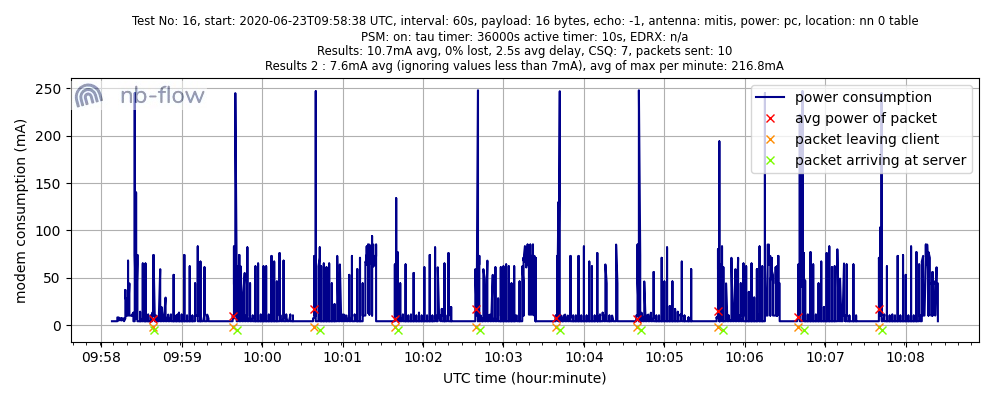
| countryside, indoors | mitis | -99 | marginal | 10.7 | 7.6 | 2.5 | 216.8 | 16.png |
| countryside, basement | mitis | -105 | marginal | 13.1 | 10.2 | 2.2 | 217.2 | 20.png |
| city, indoors | ali | -51 | excellent | 8.7 | 7.1 | 1.1 | 77.8 | 10.png |
| city basement | ali | -69 | excellent | 10.1 | 8.5 | 1.5 | 92.6 | 09.png |
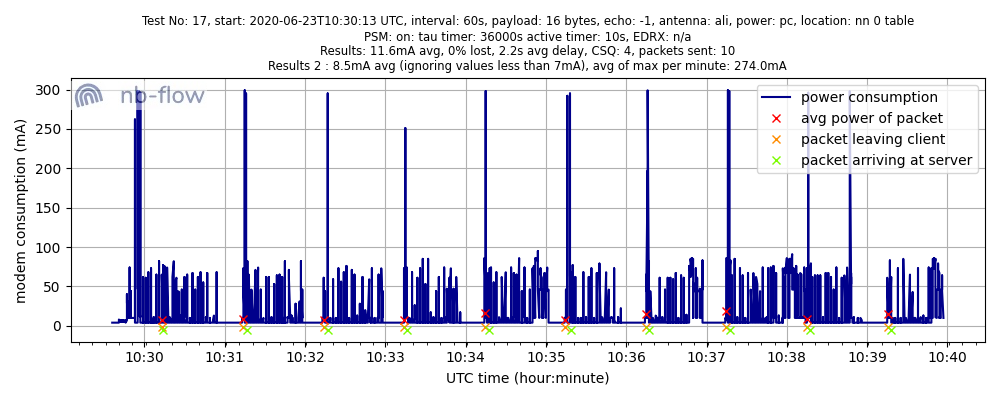
| countryside, indoors | ali | -105 | marginal | 11.6 | 8.5 | 2.2 | 274 | 17.png |
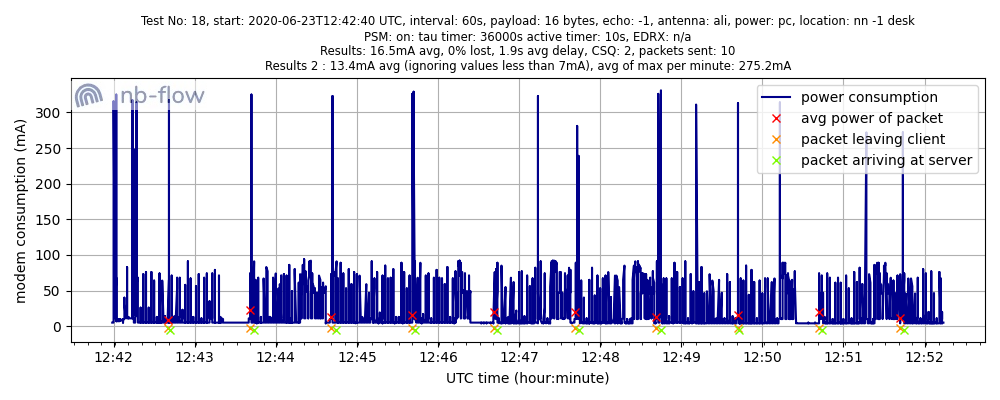
| countryside, basement | ali | -109 | marginal | 16.5 | 13.4 | 1.9 | 275.2 | 18.png |
Discussion:
- only 1 packet send from the basement did not arrive on the server, all others arrived.
- the
avg powerincreases when the signal quality is worse, however just by a factor of less than 2. - the
latencygoes up slightly with worse signal quality - the
avg max power (mA)which is the average of the maximum values per minute goes up a lot (up to a factor of 4). However that peak is only reached for a small period and afterwards the power consumption behaviour is similar (See the chart below). - we observed via the lab power supply that after the modem has sent a package, it goes to ca 0mA (not exactly, but between 0 and 1mA). However the analogue input from the esp8266
never goes fully back to 0mA, but ranges somewhere between 0 and 6 mA. From the lab power supply however we know it should be 0mA. And unfortunately this "offset" can change.
The tests in the city have a lower offset of 2mA whereas in the countryside it was rather 5mA. That's why for the
avg power 2
we ignored all the values that are less than 7mA. This is the biggest drawback the hardware setup which is why the "real" average can be off by up to 5mA, however the trends that are observed are still valid. - the
mitisantenna had a slightly better coverage value (dBm) and a loweravg max power (mA) - conversions from CSQ (which is what the modem returns) to dBm according to this site
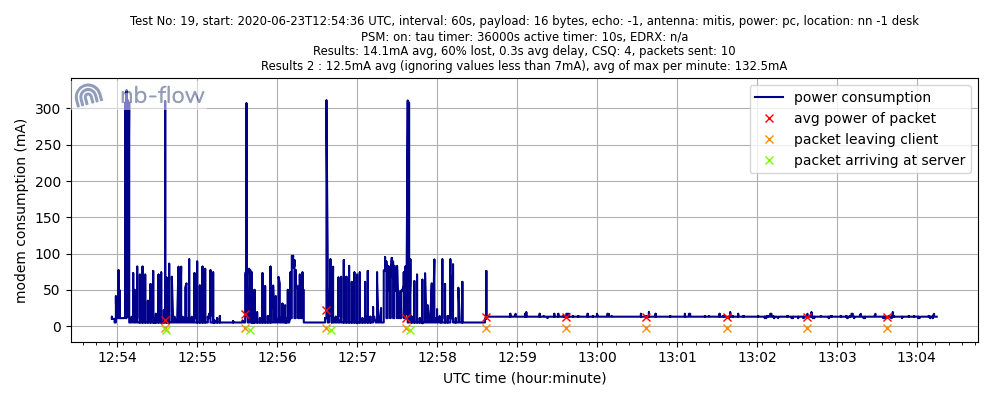
The picture below shows the result from test 16. The peaks when the packet is sent are close to 250mA. Also the time that the modem is consuming power after the packet is ca 40 seconds compared to the ca 15 seconds in the chart above.
Scenario 2
- packets sent: 10
- interval: 60 seconds
- signal quality: -51dBm / excellent
| antenna | bytes | avg p(ma) | avg p 2(mA) | lat(s) | avg max p(mA) | diagram |
|---|---|---|---|---|---|---|
| mitis | 16 | 10.3 | 8.8 | 1.5 | 78.1 | 13.png |
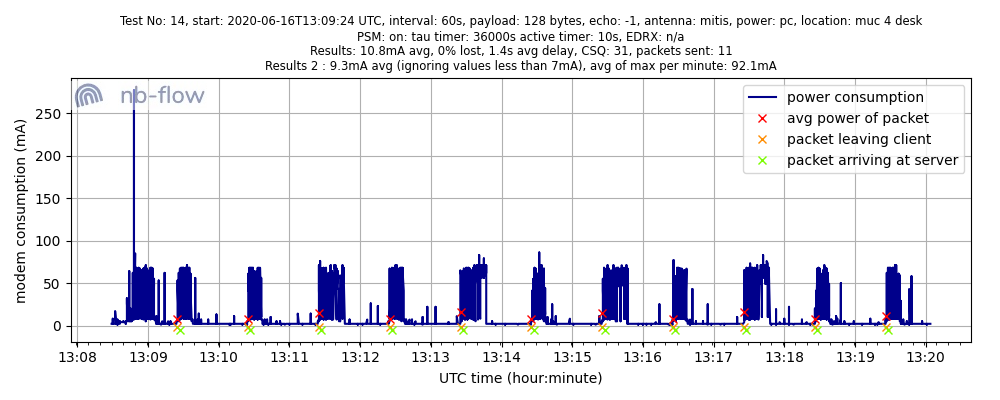
| mitis | 128 | 10.8 | 9.3 | 1.4 | 92.1 | 14.png |
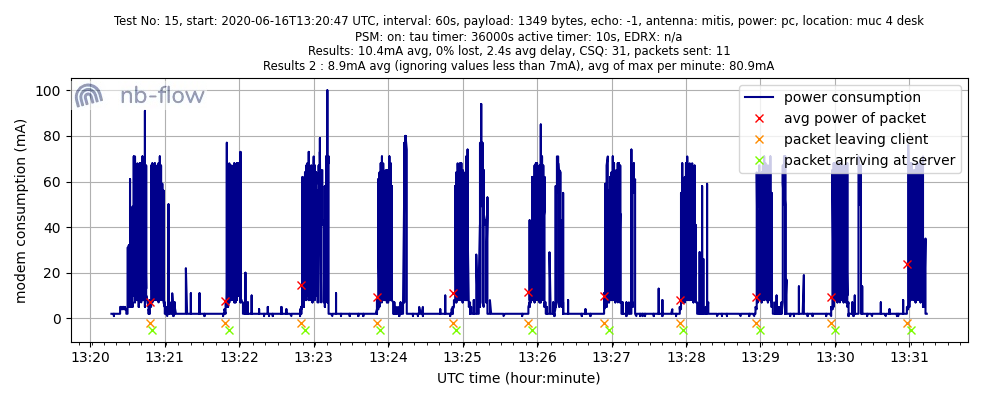
| mitis | 1349 | 10.4 | 8.9 | 2.4 | 80.9 | 15.png |
| ali | 16 | 8.7 | 7.1 | 1.1 | 77.8 | 10.png |
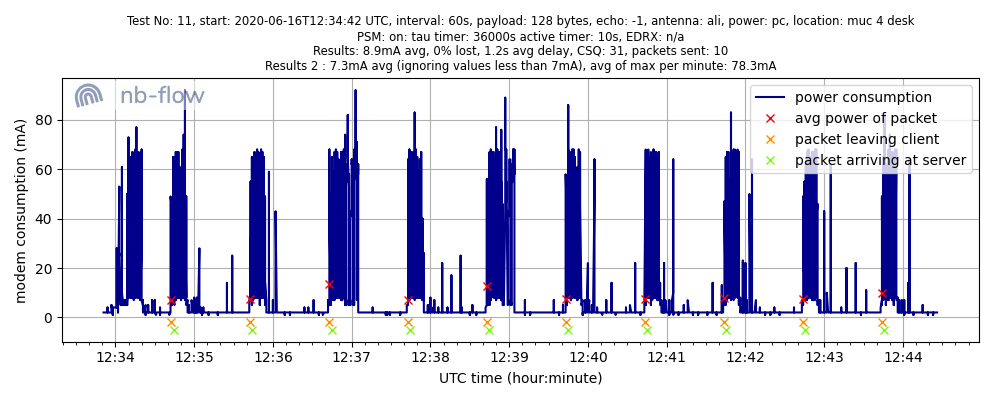
| ali | 128 | 8.9 | 7.3 | 1.2 | 78.3 | 11.png |
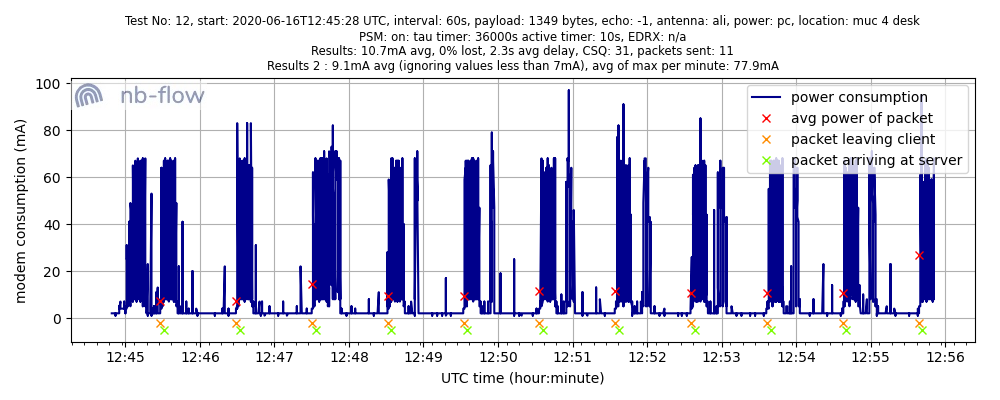
| ali | 1349 | 10.7 | 9.1 | 2.3 | 77.9 | 12.png |
Discussion:
- all packets arrived on the server
- the packet size has no significant effect on the power consumption which is surprising. So trying to combine messages into one large message can significantly save power.
- the latency increases with larger packet size (by a factor of less than 2)
- no significant difference between the mitis and the ali antenna in terms of power consumption
Additional observations
During one test at marginal signal quality the modem got stuck and did not sent the packets anymore.
It is interesting to see that the power consumption is at around 13mA when it is stuck. As this is quite
high and could drain the battery, the microcontroller that is controlling the modem has to watch out for this state and either turn off the modem
or restart it.
Improvements
We will improve the ADC readings to get rid of the zero offset. As explained above, the ADC showed the modem was consuming power even though the lab power supply did not indicate it. To get better absolute readings, it is crucial to use an accurate ADC.
Currently, the logs from the server are copied manually after the tests. This will be automated so multiple tests can be conducted back to back without human intervention.
Further testing
In the next blog posts, the following parameters will be changed:
- the server will echo the packet after a certain time to be able to measure the percentage of packets that are successfully sent back
- different settings for the PSM (power saving mode)
- using a larger, external antenna
- the interval at which the packets are sent.
- use a different modem
Thanks for reading, if you have any questions about the article we are happy to answer them. Just send us an email (info@nb-flow.com).